Kamikitayama
Kamikitayama
上北山村 | |
|---|---|
Village | |
 Kamikitayama Village | |
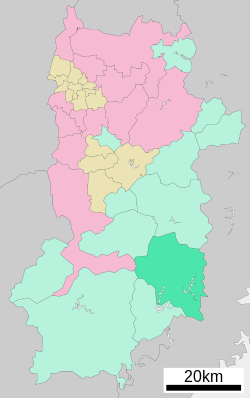
 Location of Kamikitayama in Nara Prefecture | |
| Coordinates: 34°8′N 136°0′E / 34.133°N 136.000°E | |
| Country | Japan |
| Region | Kansai |
| Prefecture | Nara Prefecture |
| District | Yoshino |
| Area | |
• Total | 274.05 km2 (105.81 sq mi) |
| Population (October 1, 2016) | |
• Total | 486 |
| • Density | 1.8/km2 (4.6/sq mi) |
| Time zone | UTC+09:00 (JST) |
| City hall address | 330 Kawai, Kamikitayama-mura, Nara-ken 639-3701 |
| Climate | Cfa |
| Website | vill |
| Symbols | |
| Bird | Lesser cuckoo (Cuculus poliocephalus) |
| Flower | Lilium auratum (mountain lily) |
| Tree | Zelkova serrata (Japanese elm) |
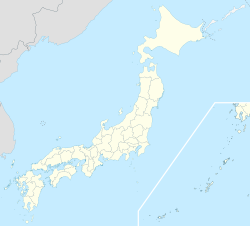
Kamikitayama (上北山村, Kamikitayama-mura) is a village located in Yoshino District, Nara Prefecture, Japan.
As of October 1, 2016, the village has an estimated population of 486. The total area is 274.05 km2.
The village has an aging population. Between 2002 and 2007 the population declined by 15.6%. This trend has continued. It is one of the villages expected to be extinct by 2040.[citation needed]
Geography
[edit]Neighboring municipalities
[edit]Climate
[edit]Kamikitayama has a humid subtropical climate (Köppen climate classification Cfa) with hot summers and cool to cold winters. Precipitation is significantly higher in summer than in winter, though on the whole lower than most parts of Honshū. There is no significant snowfall. The average annual temperature in Kamikitayama is 13.5 °C (56.3 °F). The average annual rainfall is 2,909.3 mm (114.54 in) with September the wettest month. The temperatures are highest on average in August, at around 24.6 °C (76.3 °F), and lowest in January, at around 2.9 °C (37.2 °F).[1] The highest temperature ever recorded in Kamikitayama was 39.3 °C (102.7 °F) on 17 August 2020; the coldest temperature ever recorded was −9.3 °C (15.3 °F) on 28 February 1981.[2]
| Climate data for Kamikitayama (1991−2020 normals, extremes 1978−present) | |||||||||||||
|---|---|---|---|---|---|---|---|---|---|---|---|---|---|
| Month | Jan | Feb | Mar | Apr | May | Jun | Jul | Aug | Sep | Oct | Nov | Dec | Year |
| Record high °C (°F) | 17.6 (63.7) |
21.9 (71.4) |
26.3 (79.3) |
31.1 (88.0) |
34.2 (93.6) |
37.0 (98.6) |
38.3 (100.9) |
39.3 (102.7) |
37.1 (98.8) |
29.7 (85.5) |
24.0 (75.2) |
21.4 (70.5) |
39.3 (102.7) |
| Mean daily maximum °C (°F) | 8.1 (46.6) |
9.6 (49.3) |
13.6 (56.5) |
19.2 (66.6) |
23.6 (74.5) |
25.9 (78.6) |
30.0 (86.0) |
31.1 (88.0) |
27.0 (80.6) |
21.4 (70.5) |
15.8 (60.4) |
10.2 (50.4) |
19.6 (67.3) |
| Daily mean °C (°F) | 2.9 (37.2) |
3.7 (38.7) |
7.1 (44.8) |
12.0 (53.6) |
16.6 (61.9) |
20.1 (68.2) |
23.9 (75.0) |
24.6 (76.3) |
21.2 (70.2) |
15.5 (59.9) |
9.9 (49.8) |
4.8 (40.6) |
13.5 (56.4) |
| Mean daily minimum °C (°F) | −0.9 (30.4) |
−0.7 (30.7) |
1.8 (35.2) |
6.2 (43.2) |
11.1 (52.0) |
15.9 (60.6) |
20.0 (68.0) |
20.6 (69.1) |
17.4 (63.3) |
11.5 (52.7) |
5.5 (41.9) |
0.8 (33.4) |
9.1 (48.4) |
| Record low °C (°F) | −7.9 (17.8) |
−9.3 (15.3) |
−5.5 (22.1) |
−3.8 (25.2) |
0.9 (33.6) |
5.3 (41.5) |
12.8 (55.0) |
10.9 (51.6) |
6.8 (44.2) |
0.0 (32.0) |
−2.9 (26.8) |
−6.1 (21.0) |
−9.3 (15.3) |
| Average precipitation mm (inches) | 80.7 (3.18) |
104.4 (4.11) |
164.2 (6.46) |
175.2 (6.90) |
223.4 (8.80) |
316.1 (12.44) |
397.1 (15.63) |
450.5 (17.74) |
499.7 (19.67) |
277.1 (10.91) |
119.9 (4.72) |
87.7 (3.45) |
2,909.3 (114.54) |
| Average precipitation days (≥ 1.0 mm) | 8.0 | 9.0 | 11.5 | 10.5 | 11.5 | 14.5 | 14.0 | 12.8 | 13.3 | 11.9 | 8.4 | 8.0 | 133.4 |
| Mean monthly sunshine hours | 131.0 | 131.1 | 163.0 | 183.7 | 188.9 | 132.0 | 156.7 | 178.5 | 133.7 | 136.3 | 134.8 | 134.9 | 1,807.6 |
| Source: Japan Meteorological Agency[2][1] | |||||||||||||
Demographics
[edit]Per Japanese census data, the population of Kamikitayama in 2020 is 444 people. The population has been consistently declining over the last 50 years.[3] Kamikitayama has been conducting censuses since 1920.
| Year | Pop. | ±% |
|---|---|---|
| 1920 | 4,421 | — |
| 1925 | 3,346 | −24.3% |
| 1930 | 3,463 | +3.5% |
| 1935 | 3,865 | +11.6% |
| 1940 | 2,928 | −24.2% |
| 1945 | 2,233 | −23.7% |
| 1950 | 2,337 | +4.7% |
| 1955 | 2,543 | +8.8% |
| 1960 | 3,806 | +49.7% |
| 1965 | 2,007 | −47.3% |
| 1970 | 1,717 | −14.4% |
| 1975 | 1,463 | −14.8% |
| 1980 | 1,155 | −21.1% |
| 1985 | 1,123 | −2.8% |
| 1990 | 1,046 | −6.9% |
| 1995 | 1,023 | −2.2% |
| 2000 | 915 | −10.6% |
| 2005 | 802 | −12.3% |
| 2010 | 683 | −14.8% |
| 2015 | 512 | −25.0% |
| 2020 | 444 | −13.3% |
| Kamikitayama population statistics[3] | ||
Education
[edit]- Primary Schools
- Kamikitayama Elementary School
- Junior High Schools
- Kamikitayama Junior High School
As of 2012 the two schools have a combined student population of 27. Even with such a small student body, in 2009 the village began employing an ALT(Assistant Language Teacher) of English from the JET Programme to live and work in village.
Notable places
[edit]- Higashinokawa Post Office
- Mount Ōdaigahara
- Sakamoto Dam
- Yoshino-Kumano National Park
References
[edit]- ^ a b 気象庁 / 平年値(年・月ごとの値). JMA. Retrieved April 12, 2022.
- ^ a b 観測史上1~10位の値(年間を通じての値). JMA. Retrieved April 12, 2022.
- ^ a b Kamikitayama population statistics
External links
[edit] Media related to Kamikitayama, Nara at Wikimedia Commons
- Kamikitayama official website (in Japanese)


